The overlapping crises of extreme heat and Covid-19 “severely stretched” an already overwhelmed healthcare system in the UK with “deadly consequences”, a new study finds.
The research, published in Nature Climate Change, estimates the number of heat- and cold-related deaths in England and Wales before and during the Covid-19 pandemic.
The study finds that pressure on the health system during heatwaves was as much as three times higher for the pandemic years than it was in the previous decade. The authors find a similar result during cold periods.
The number of heat-related deaths “shifted higher” in the Covid-19 years, the study says, suggesting that Covid “may have impacted temperature-related mortality during extreme weather events”.
The authors warn that “if health services are already operating at capacity because of one crisis, the additional health burden from another crisis can break the system entirely, endangering the lives of many people”.
One expert not involved in the study tells Carbon Brief that any future pandemic is likely to be a “syndemic”, where its impacts intertwine with those of a changing climate.
And as similar groups tend to be most vulnerable to both major disease outbreaks and extreme weather, anticipating and preparing for the co-occurrence of such events “would be lifesaving”, the study authors conclude.
Heat, cold and Covid
Extreme weather events and pandemics are among the most serious risks facing the UK, according to the UK National Risk Register. Since 2020, both have claimed thousands of lives in the UK.
Between the UK’s first documented Covid-19 case on 30 January 2020 and the end of 2022, around 190,000 people in England and Wales died of the virus, according to death certificates.
Over this two-year study period, the UK has also seen extreme hot and cold temperatures – from the coldest UK temperature in more than 20 years during February 2021 to the country’s first recorded instance of 40C heat in July 2022.
To assess the link between temperature and mortality, the authors produced “epidemiological models” that analyse exposure to different temperatures and human mortality in different regions of the UK.
Dr Eunice Lo is a research fellow in climate change and health at the University of Bristol and lead author on the study. She tells Carbon Brief that “heatstroke and heat exhaustion can occur quite rapidly” and that, in her models, “we expect the mortality outcome to be within three days of exposure to heat”. In contrast, it takes longer for cold snaps to cause mortality, she adds.
The plot below illustrates the example of London. The lowest point on the curve – indicated by a “relative risk” level of one – shows the optimum temperature, when people are at lowest risk of physiological harm from temperature extremes.
If the temperature rises above (red) or falls below (blue) the optimum temperature, the risk of temperature-related mortality increases. This is indicated by a relative risk level greater than one.
Cumulative relative risk of death in London for the overall population, using data from 1981-2022. Source: Lo et al (2024).
The authors developed a series of models for locations across England and Wales. The study estimates that, over the study period, almost 8,500 excess deaths were attributable to high temperatures and more than 125,000 deaths to cold.
The study points out that cold-related deaths are more common in the UK as “most days of the year are considered moderately cold”. As the planet continues to warm, heat-related deaths are expected to rise, while cold-related deaths will likely fall.
Lo tells Carbon Brief that factors including age and socioeconomic status also affect temperature-related mortality, but these were not included in the model.
Extreme temperatures
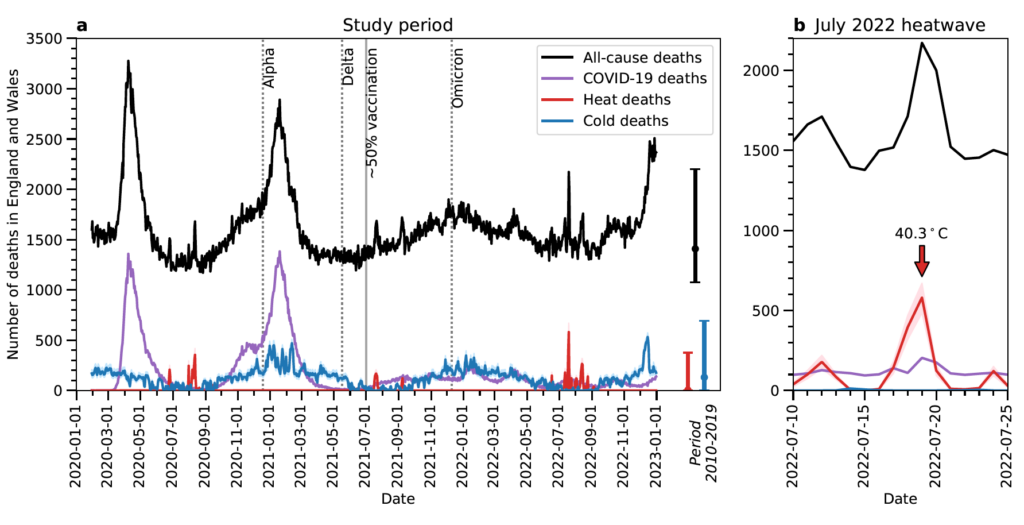
The chart below, from the study, shows a timeseries of daily deaths attributable to heat (red), cold (blue) and Covid-19 (purple) in England and Wales over the study period. The black line shows deaths in the UK from all causes. The right-hand section of the chart focuses on the July 2022 heatwave, when daily heat-related mortality peaked at 580 deaths – higher than at any time of over the previous decade.

Annual “all-cause mortality” in England and Wales was higher during the pandemic than it was in the preceding decade, as Covid-19 drove up mortality rates, the study finds.
The authors note that cold-related mortality “dominated” heat-related mortality in all months other than July, August and September – adding that spikes in cold-related mortality often coincided with spikes in deaths due to Covid.
There are a range of reasons for this. For example, low humidity in winter allows droplets containing the virus to spread further. And peoples’ immune systems are weaker in the winter due to a lack of vitamin D, making them more vulnerable to the virus.
The study also notes that, over the whole study period, “cumulative temperature-related deaths exceeded cumulative Covid-19 deaths by 8% in south-west England”. And while total temperature-related deaths did not exceed those from Covid in other regions, they did amount to 58% (East Midlands) to 75% (London) of Covid-19 deaths by the end of 2022.
The approach used in the study assumes that deaths caused by Covid-19 and temperature extremes are independent of each other. In other words, individuals are assumed to die either due to Covid or as a result of extreme temperature exposure, but not a combination of the two.
Nonetheless, the findings suggest that Covid “may have impacted temperature-related mortality during extreme weather events”, the study says. For example, “heat-related mortality shifted higher in the Covid-19 years”, compared to extreme events that were not affected by the disease, the authors note.
At the same time, “extreme heat may have exacerbated Covid-19 mortality”, the authors note, pointing out that on 19 July 2022 – the day that 40C heat was recorded – Covid caused 91 more deaths than the daily average over 10-25 July.
The results “highlight the complex interplay between extreme temperatures and the Covid-19 pandemic, as well as its implications on population health and health services capacity”, the study says.
Mapped
The study maps out Covid- and temperature-related deaths to see how they vary regionally.
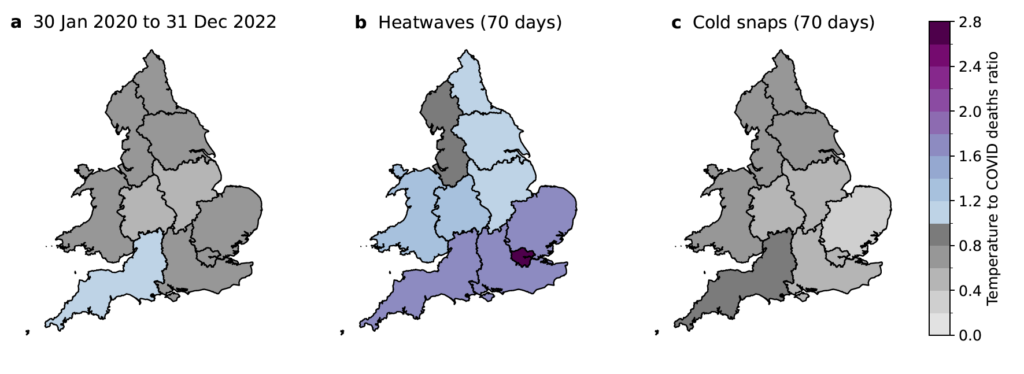
The authors select 70 heatwave days and 70 cold days from the 30 January 2020 to 31 December 2022 study period. They then calculate regional mortality rates due to Covid, heat and cold during these days.
The maps below show the ratio of temperature-related deaths to Covid-driven deaths over the full study period (left), heatwave period (middle) and cold period (right). Numbers below zero, shown in grey, indicate that Covid-related deaths are higher than temperature-related deaths. Numbers above zero, shown in blue and purple, indicate that temperature-related deaths are higher.

During heatwaves, heat-related deaths far exceed deaths due to Covid-19 in almost all the regions studied. The study finds that the ratio of temperature to Covid-related deaths was highest in London at 2.7, where temperatures tend to be higher.
(This is likely due, in part, to the urban heat island effect – in which a combination of factors, such as buildings, reduced vegetation and high domestic energy use, cause urban areas to become hotter than more rural regions.)
This finding shows that “that even during the Covid-19 pandemic, heatwaves posed a serious threat to public health”, the study says.
Meanwhile, during cold snaps – when both cold-related mortality and deaths due to Covid spiked – Covid-related mortality was higher. The ratio ranges from 0.4 in east of England to 0.8 in south-west England.
The authors suggest that this is mainly due to “large surges in Covid-19 mortality following the first emergence of the coronavirus and the domination of the Alpha variant, both of which occurred in winter”.
The authors then performed the same heatwave and cold snap calculations for the decade preceding the pandemic, to provide a 2010-19 pre-Covid baseline.
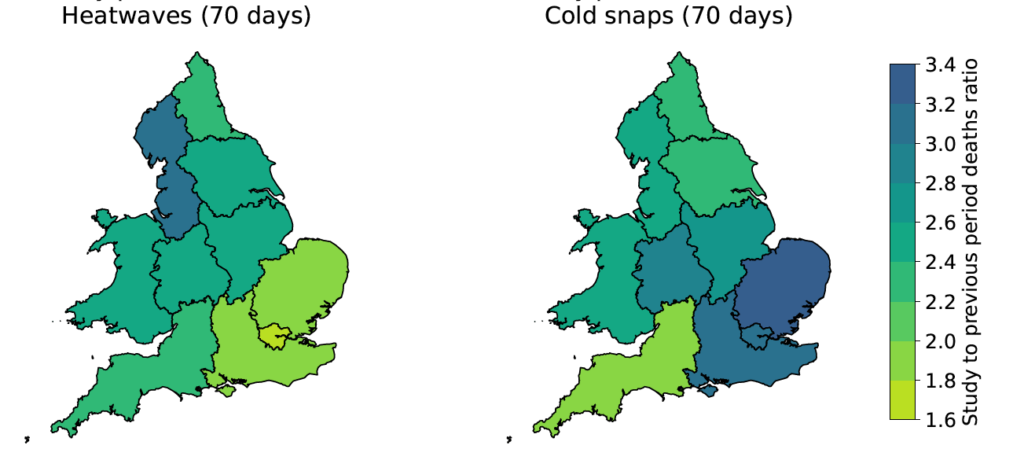
The maps below show the ratio of average annual deaths per 100,000 people during the Covid study period to that during the preceding decade, during heatwaves (left) and cold snaps (right). Lighter green indicates that mortality rates in the Covid and pre-Covid periods were similar, while darker colours indicate that deaths during the Covid study period were higher.

The authors find that during pre-Covid heatwave days, heat-related deaths ranged from six to 14 people per 100,000. They add that during the Covid-19 study period, deaths due to heat and Covid-19 together range from 19 to 24 deaths per 100,000 people.
The authors assume that mortality broadly links to regional demand on health services. As such, they estimate that demand on regional health services was between 1.6 (London) and 3.2 (north-west England) times higher during the pandemic than in the previous decade.
By carrying out the same analysis, the authors find that during cold snaps, demand on health services was between 2.0 (south-west England) and 3.4 (east of England) times higher during Covid than in the previous decade.
The paper highlights “the deadly consequences of an already overwhelmed NHS severely stretched to function through the compound crises of extreme weather and Covid-19”, the authors say, adding:
“If health services are already operating at capacity because of one crisis, the additional health burden from another crisis can break the system entirely, endangering the lives of many people.”
Dr Kristina Dahl is senior climate scientist at the Union of Concerned Scientists. In 2020, she was a co-author on a comment paper in Nature Climate Change on the compound risks of climate change and the Covid pandemic.
Dahl tells Carbon Brief that the results of this study highlight the need for “amplified public messaging to increase awareness of temperature-related risks”, for “stronger policies and protections around extreme weather”, and to “more adequately prepare public health systems for the co-occurrence of hazards”.
Co-occurring hazards
Despite the study treating temperature- and Covid-related deaths as independent, Lo tells Carbon Brief that “there is certainly a two-way interaction” between the two.
She explains that “a lot of vulnerabilities to temperatures and Covid-10 are shared”, noting that elderly people and those with pre-existing conditions are vulnerable to both extreme temperatures and viruses. This means that one could exacerbate the other, she warns.
She adds that many measures taken to reduce the spread of Covid may have contributed to a rise in temperature-related death. For example, closing social spaces, such as swimming pools and air-conditioned buildings, meant that many people “didn’t have as much of an escape” from the high temperatures in their homes, she says.
Dr Colin Carlson is an assistant research professor at Georgetown University’s centre for global health, science and security and another co-author on the Nature Climate Change comment paper.
Carlson, who studies the relationship between global climate change, biodiversity loss and emerging infectious diseases, tells Carbon Brief that “for the last two decades, we’ve been operating in a very limited framework with how we think about climate change and infectious disease”.
He adds that “going forward, every pandemic will probably be a ‘syndemic’ with a few climate change-related components”.
Lo notes that while this study focuses on the relationship between Covid-19 and extreme temperatures, it speaks to a larger point about the link between climate-related extremes and other hazards, as co-occurring crises can threaten healthcare and other key systems.
Similarly, Dahl warns:
“As climate-related extremes become more frequent, the likelihood that they will intersect with other crises – whether related to public health, social or political unrest, or other environmental problems – will increase.”
Lo, E. et al. (2024) Compound mortality impacts from extreme temperatures and the Covid-19 pandemic, Nature Climate Change, doi:10.1038/s41467-024-48207-2
Sharelines from this story


