

A global shift towards a diet that reduces “overconsumption” in meat and dairy products could cut 17% of global food emissions annually, new research shows.
According to the study, published in Nature Climate Change, if consumers with higher dietary emissions reduced their red meat consumption in favour of more legumes and nuts, global food-system emissions would fall by 32%.
At the same time, improving the diets of “underconsuming” populations would result in a 15% increase in dietary emissions.
The researchers analysed the emissions from food products consumed by two kinds of populations – those who consume higher levels of animal-based products and those who have lower intakes of these foods – in more than 100 countries. Then, they modelled the changes in emissions resulting from a potential shift in the global diet.
The study also analyses how diets – and their emissions – vary by income group within individual countries. The findings suggest that inequalities in dietary emissions are “more pronounced” within low-income countries.
The authors suggest that changing the food choices of consumers could not only contribute to mitigating climate change, but also to addressing inequality and food security.
Dietary emissions
Food systems make up about one-third of global greenhouse gas emissions.
These emissions vary greatly between different regions, but they also vary within a given country, due to a population’s food preferences, lifestyles and income.
To find out how each population group contributes to dietary emissions, the researchers analysed emissions along the supply chain of 140 different food products, including emissions from agricultural land-use change.
Then, using a database of consumption patterns of different population groups – classified by household expenditure – they calculated the distribution of dietary emissions in 139 countries or areas.
The authors found that in many regions and countries, total meat and dairy emissions exceed those from plant-based foods – even though meat and dairy typically account for less than one-quarter of calories consumed.
This is not necessarily an indicator of wealth. Both high-income countries and regions, such as Australia and the US, and lower-income ones, such as India and the rest of east Asia, generate the majority of their food-related emissions from animal-based diets.
However, in many other low-income countries and regions, including Indonesia, the rest of south-east Asia and sub-Saharan Africa, plant-based foods produce most dietary emissions.
The map below shows the total national dietary greenhouse gas emissions (red shading) and the per-capita dietary emissions (yellow circles).
The chart shows the regional breakdown of dietary emissions by food type, including grains (light purple), dairy products (light yellow) and beef, lamb and pork (light blue). The regions are organised by GDP, from high (left) to low (right).
These trends are partially explained by cultural factors. For example, in south-east Asia, 42% of dietary emissions come from grains, due to the predominance of rice-based dishes.
The affordability of varied food also plays a role, the authors say. For example, high prices of animal-based foods lead many lower-income countries and individuals to opt for starchy staple foods that are cheaper, but contain high levels of carbohydrates, as in south-east Asia and sub-Saharan Africa.
Diet and income
The researchers also examined the differences in dietary emissions within countries.
The following chart shows the breakdown of dietary emissions by food type (in the coloured bars). Each country or region is broken down into deciles based on wealth, with the lowest-income 10% of the population on the left and the highest-income 10% on the right.
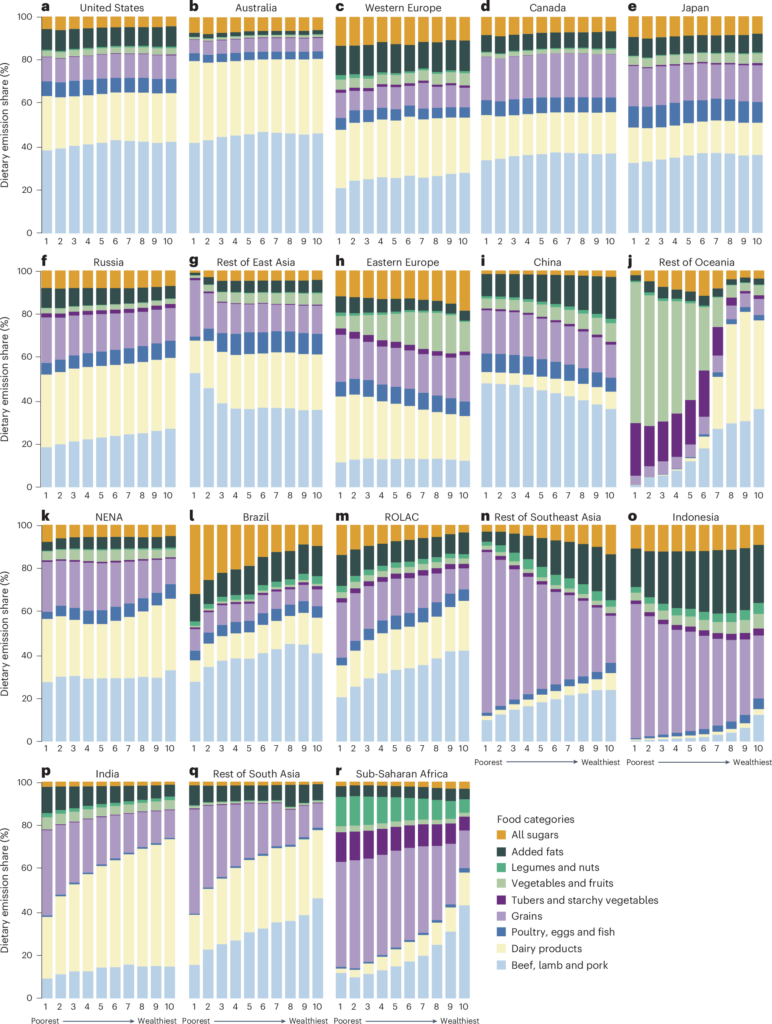
In some countries, the consumption of red meat and dairy products is similar regardless of the population group. For example, in the chart above, consumption of beef, lamb and pork (light blue), dairy (light yellow) and poultry, eggs and fish (blue) in the US, Australia and Canada are at similar levels across all income groups.
However, in other countries, such as Russia, India, Brazil and the rest of Latin America, as individuals’ expenditure increases, per-capita consumption of red meat and dairy products tends to rise – along with their dietary greenhouse gas emissions, according to the chart.
One exception is parts of east Asia, where the poorest population has high dietary emissions due to a substantial intake of red meat. For example, the research says, consumption of beef and mutton is common among lower-income populations in Mongolia.
Dr Andrêa Ferreira, a postdoctoral scholar at Drexel University and a senior researcher at the Iyaleta Research Association, an independent research collective in Brazil, says that the researchers made an “amazing” effort in attempting to collect standardised global data on food consumption and expenditure.
However, Ferreira cautions that the data might not consider the many aspects influencing how people and nations choose and use certain foods, including gender inequalities and cultural practices.
A more equitable diet
Although previous studies have addressed emissions from food consumption, the novelty of this research, the authors say, is that it breaks down these emissions by expenditure groups. Furthermore, the study models how a global diet shift could reduce inequities between these groups.
For comparison, the researchers chose the EAT-Lancet “global planetary health diet”, a model diet designed to be “healthy for both people and planet”. The EAT-Lancet diet suggests increasing the consumption of vegetables, fruits, nuts and legumes, and reducing meat and dairy intake. For example, the diet suggests consuming no more than 98 grams of red meat (pork, beef or lamb), 203 grams of poultry and 196 grams of fish per week.
Yanxian Li, the lead author of the study, says her research team chose that diet because it provides detailed intake numbers for different food products and it has been widely used in research, allowing them to compare their results with previous studies. Furthermore, the EAT-Lancet diet is flexible and can take into account different local customs and cultural practices.
Li, who is a PhD researcher at Integrated Research on Energy, Environment and Society (IREES) at University of Groningen in the Netherlands, tells Carbon Brief:
“We have to realise that different [countries] have different diet structures. For example, some Muslim countries don’t eat pork. We [wanted] to find an option which can [be] compatible with local diets”.
Li and her colleagues found that if the entire world adopted the EAT-Lancet diet, the global dietary emissions would drop by 17%, compared to 2019 levels.
High-income groups in mid- and high-income countries would cut 32.4% of global dietary emissions by reducing their intake of meat and dairy products. However, this reduction would be partially offset by an increase of 15.4% in emissions of poorer populations that would result from them achieving a balanced, nutritious diet, particularly in sub-Saharan Africa and the Middle East.
To achieve such a global dietary change, the study suggests policymakers set up a wide range of incentives, from carbon pricing and “eco-labelling” to policies to lower the cost of and widen access to healthier foods for low-income populations.
Prof Klaus Hubacek, chair of IREES, a professor at University of Groningen and study co-author, says individuals can also make a difference by choosing less carbon-intensive, locally produced and seasonal food items.
The research also indicates that with the diet shift, emissions footprints from legumes and nuts would increase, due to a wider consumption of those foods from most population groups.
However, that does not mean people have to eat one or two specific products throughout their lives – more diverse diets are better for our health, Li says. She tells Carbon Brief:
“It’s important to ensure that [vulnerable groups] still have enough nutrition from animal-based products…There’s still some room for the rich people to save some good resources for the poor ones”.
Ferreira says this flexibility is more realistic than asking everybody to become vegetarian or vegan, which “doesn’t take into account that food is about culture”.
She suggests having a diverse diet and improving access to nutritionists and nutritional education, telling Carbon Brief:
“I see food as a right, so I work with the perspective that each of us should be allowed to choose the best practice to eat…For me, it’s [about] how we move forward to a balanced diet, and we assure the right of food diversity all over the world.”
Li, Y. et al. (2024) Reducing climate change impacts from the global food system through diet shifts, Nature Climate Change, doi:10.1038/s41558-024-02084-1
Sharelines from this story
