

From tree-planting to spreading silicate rock dust over land, the methods for “carbon dioxide removal” (CDR) vary in approach, impacts, readiness and cost.
The second “State of CDR” report, led by a collaboration of scientific institutions from Europe and the US, aims to summarise where the world currently stands when it comes to removing CO2 from the air.
The report covers everything from how many tonnes are currently being “drawn down” from the atmosphere and stored through to the development of research grants, policies and media coverage.
Scientists are clear that countries must cut their emissions as fast as possible to reach climate goals.
But the use of CDR to counterbalance emissions that are difficult to eliminate completely, such as methane from rice farming, will be “unavoidable” if the world is to reach net-zero, according to the Intergovernmental Panel on Climate Change (IPCC).
However, some environmental groups have concerns that highly polluting companies and countries view CDR as an alternative to reducing emissions, with one activist describing reports such as this as a “dangerous distraction”.
Carbon Brief has trawled through the new report’s 222 pages and pulled out nine key takeaways, focusing on the updates since last year’s report.
‘Novel’ CDR is growing more rapidly than conventional methods, despite downward revision
There are many ways to remove CO2 from the atmosphere. These methods have “different levels of readiness, potential and durability” and various “sustainability risks that could limit their deployment”, the report says.
CDR techniques, also known as “negative emissions”, already remove 2bn tonnes of CO2 from the atmosphere each year, the report says, versus the 40bn tonnes that human activities emit each year.
Almost all of this comes from “conventional” CDR methods. “Conventional” methods are those that are “well established” and “widely reported” by countries as part of land use, land-use change and forestry activities (often referred to as “LULUCF”), chiefly through tree-planting and forest restoration.
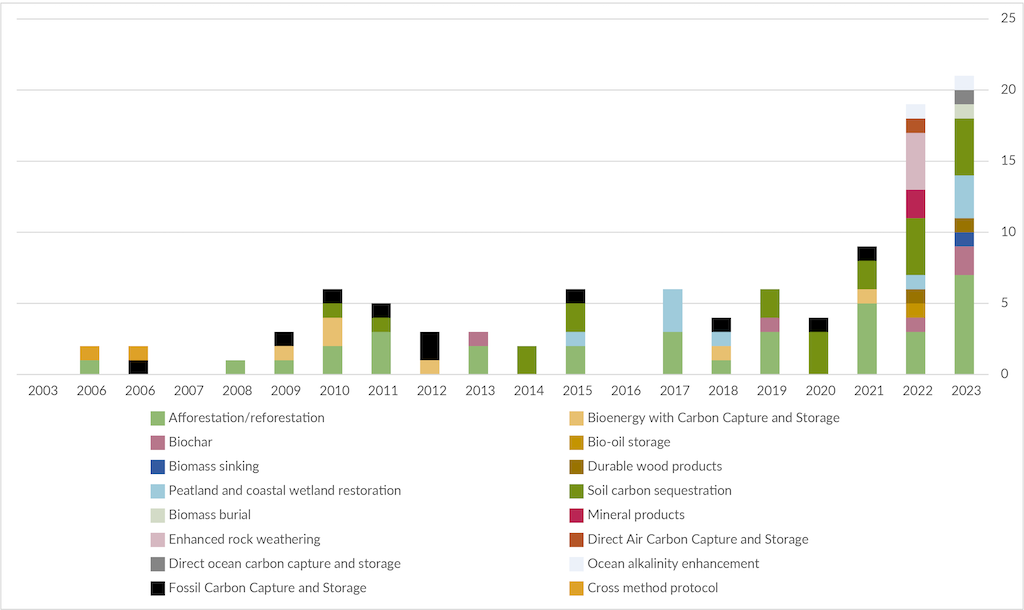
Early-stage or “novel” CDR methods currently remove a much smaller 1.3m tonnes of CO2 each year – less than 0.1% of total CDR.
This is demonstrated in the graphic below, which compares “conventional” CDR (grey) to “novel” techniques (yellow to black).
“Novel” techniques include bioenergy with carbon capture and storage (BECCS), a technology where plants are burned for energy, with the CO2 emitted captured from air and stored under land or sea.
It also includes “biochar”, which involves spreading charcoal over land to boost soil carbon, and “enhanced rock weathering”, which involves spreading finely ground silicate rock over land or sea to enhance the natural weathering process.
Despite making up the smallest proportion of CDR, “novel” techniques are growing faster than “conventional” methods, in terms of tonnes of CO2 removed each year.
“Novel” CDR removed 660,000 tonnes of CO2 in 2021 and 1.35m tonnes of CO2 in 2023, the report says.
However, the estimate for “novel” CDR in 2023 is smaller than it was projected to be in the first edition of the state of CDR report.
This is due to “improved estimation methods” in the new state of the climate report, which are in alignment with the methods used by the Global Carbon Budget, the authors say.
The report says that countries with the highest levels of CDR through tree-planting and forest restoration are China, the US, Brazil and Russia. If the EU27 were a country, it would be the first or second largest nation for tree-planting.
Based on available data, the country with the largest contribution to novel CDR is the US, as it hosts all the BECCS plants that are currently in operation, the report adds.
Back to top
The report identifies a new subset of future scenarios that take sustainable development into account
Under the Paris Agreement, countries agreed to limit global warming to well below 2C above pre-industrial levels, with an ambition of keeping them at 1.5C.
Scientists have devised a range of possible scenarios for how the world could keep temperatures at 1.5C. All of these scenarios feature some level of CDR, the report notes.
The report says that, although the Paris Agreement states that climate action must be done “in the context of sustainable development”, most scenarios do not explicitly consider social and environmental sustainability.
For the first time this year, the report identified a subset of scenarios that could be considered “more sustainable”.
The authors considered a scenario to be “sustainable” if it involved:
- Halting deforestation and ecosystem degradation, as well as protecting biodiversity.
- Reducing the number of people at risk from hunger.
- Limiting the growth of global energy demand, while enhancing equitable access to energy.
- Limiting reliance on energy from biomass, to reduce pressure on land and water.
- Keeping temperature rise well below 2C, striving to limit it to 1.5C.
Across this group of “sustainable” 1.5C scenarios, a central range of 7-9bn tonnes of CO2 will need to be removed each year by 2050, the report says.
It adds that “sustainable” scenarios “deploy less cumulative CDR and much less novel CDR than other mitigation scenarios”.
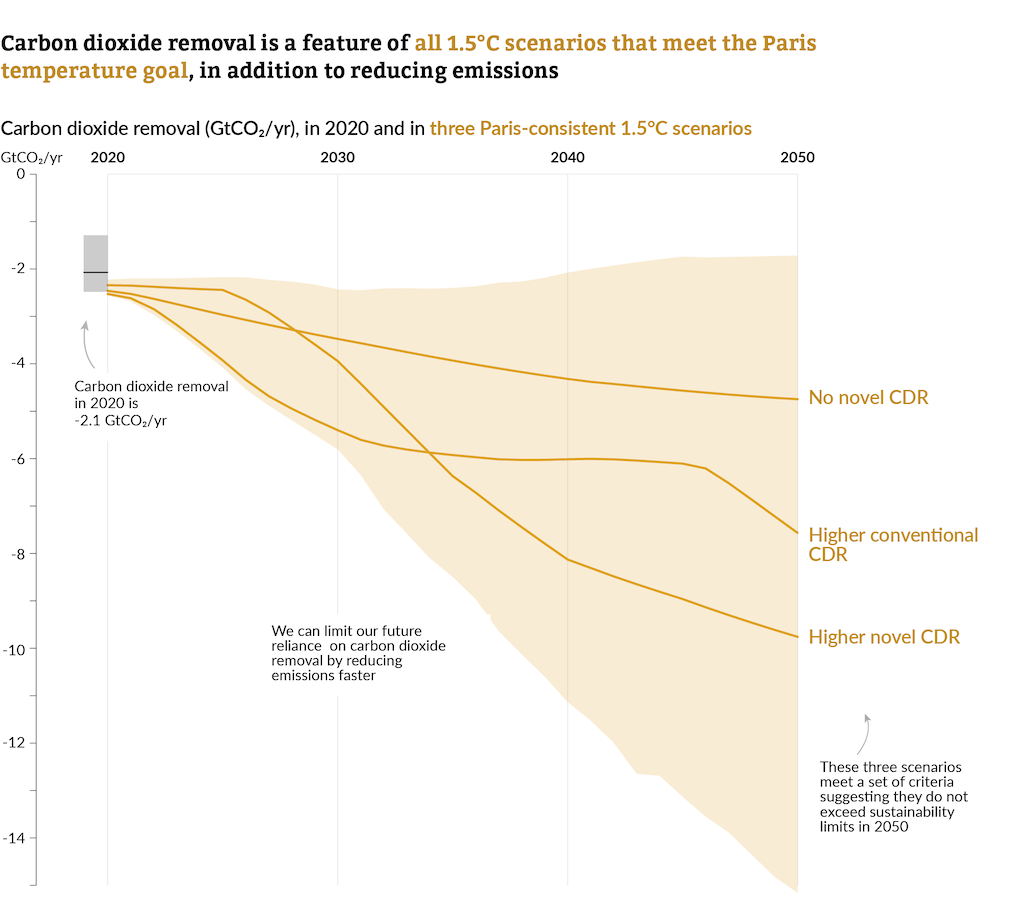
The chart below shows the amount of CO2 removed each year between 2020 and 2050 under a range of 1.5C-consistent scenarios.
It highlights three “focus scenarios” for meeting 1.5C in a “sustainable way”. This includes one focused on energy demand reduction, one on boosting renewable generation and one on expanding conventional and novel CDR.
Back to top
There continues to be a CDR ‘gap’ to the Paris temperature goal
The report says that there is still a “gap” between the amount of CDR included in 1.5C-consistent pathways and the amount pledged by countries in their national climate plans, known as “nationally determined contributions” (NDCs), and long-term strategies.
Compared to the last edition, this report considers a wider range of national pledges on CDR, including pledges made up until the COP28 climate summit in Dubai in 2023.
The charts below illustrate the size of the CDR gap in 2030 and 2050, by showing the level of proposed CDR (light grey) and the level needed in various 1.5C-consistent pathways (yellow).
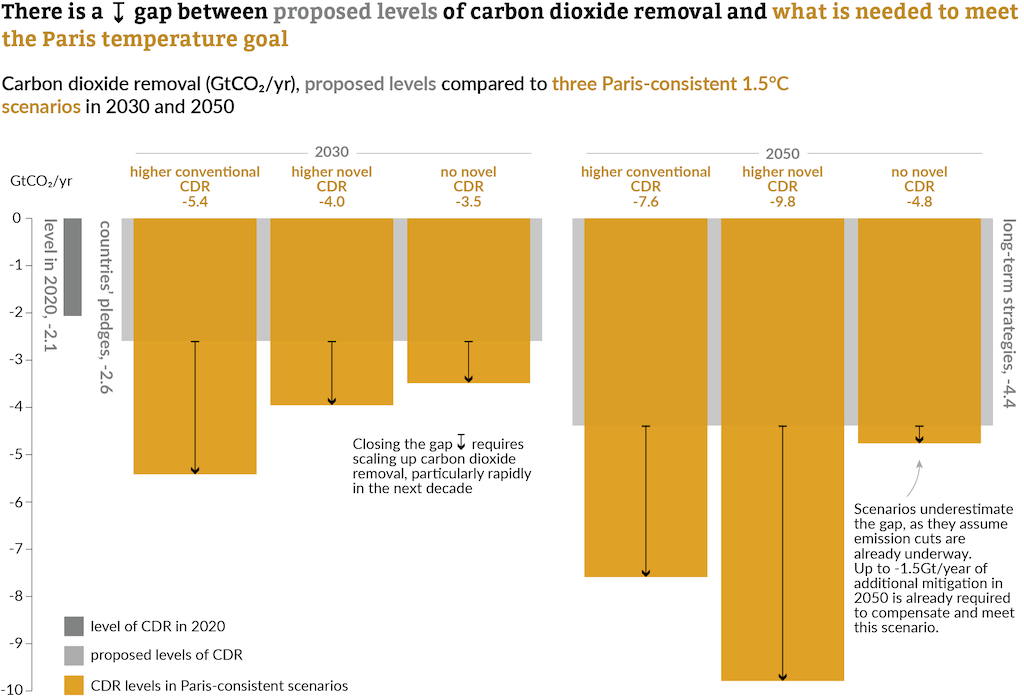
It illustrates that the size of the CDR gap depends on how much CDR is used to reach 1.5C. (This was the subject of a recent research paper covered by Carbon Brief.)
The CDR gap is small when the most ambitious national proposals are compared with levels in the “1.5C with no novel CDR scenario”, the report says.
Out of three scenarios shown on the chart above, the CDR gap ranges in size between 900m tonnes and 2.8bn tonnes of CO2 per year in 2030 and 400m tonnes and 5.4bn tonnes per year in 2050.
The report adds that, compared to its own estimates, the “actual gap is likely higher”. This is because “scenarios assume that significant emission reductions are already taking place, when in fact global emissions have continued to rise”.
Back to top
Innovation is generally intensifying, but with some recent slowdowns
The report uses various “indicators of innovation” to show that CDR activity is “generally intensifying, although with some recent slowdowns”.
The report points to the continued rapid growth in published scientific research on CDR, as well as the launch of “major” demonstration programmes.
These include the Regional Direct Air Capture Hubs in the US – which have been allocated $3.5bn in funding through president Joe Biden’s Bipartisan Infrastructure Law – and Mission Innovation, an international initiative that includes a goal to “enable CDR technologies to achieve a net reduction of 100m metric tonnes of CO2 per year globally by 2030”.
The report notes that although new CDR patents “experienced rapid growth between 2000 and 2010”, they have since started to decline. However, it adds, patents “have become more diverse and novel methods play a larger role”.
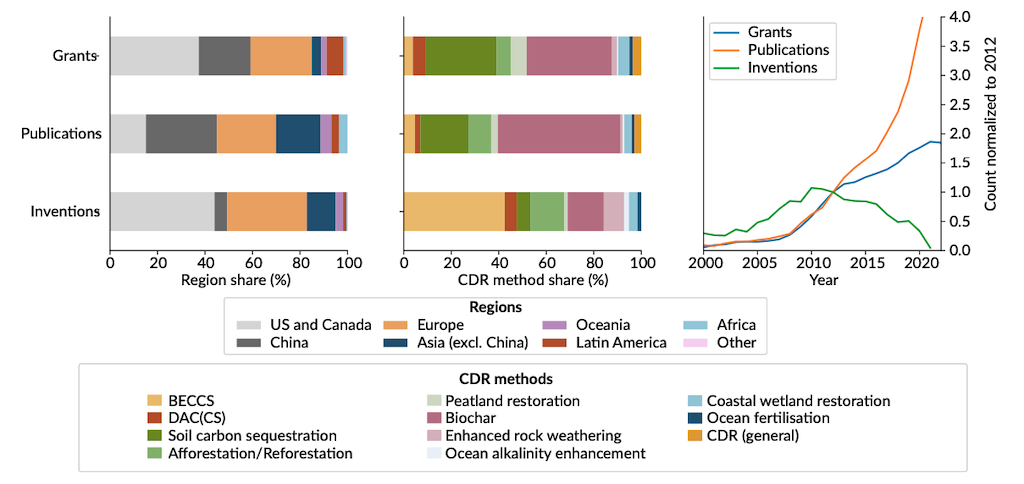
The figure below summarises these findings, showing the changing counts of research grants, publications and inventions (right), as well as the split between different regions (left) and CDR methods (middle).
There is a similarly mixed bag of progress in other indicators. For example, on CDR startup companies, the report says:
“Investment in CDR startups has grown significantly over the past decade, outpacing the climate-tech sector as a whole – although it declined in 2023, and CDR accounts for just 1.1% of investment in climate-tech start-ups.”
The report notes that direct air carbon capture and storage (DACCS) has “become a primary focus for corporate and other large investors in CDR”, adding:
“Major CDR startups such as Climeworks and Carbon Engineering have received investments from corporations that are looking to offset emissions from their core business (e.g. Microsoft, Airbus, Chevron, JP Morgan).”
The report also concludes that CDR companies and industry groups have announced capacity targets that “show ambition to reach, by mid-century or sooner, levels of CDR consistent with meeting the Paris temperature goal”. However, it adds, they have “little grounds for credibility at present”.
Back to top
There has been ‘steady growth’ in CDR research grants
The report includes – for the first time – analysis of research grants that have been awarded for CDR as one of its indicators of innovation.
This analysis uses the Dimensions database of research projects granted by third-party funding bodies, which includes the number of projects and – in about three-quarters of cases – the amount of funding.
Between 1991 and 2022, the analysis identifies grants from 131 funding organisations, such as research councils, foundations and philanthropic groups. (The data only covers specific grants, not funding coming through an institution’s central budget.) These grants went to around 1,600 research organisations and total around $2.6bn, the report estimates.
As the chart below illustrates, both the quantity (yellow bars) and value (grey) of grants have “grown steadily” in recent years. The report says:
“The number of research grants for CDR has grown from 35 active grants during 2000 to 1,160 during 2022…About 74% of all research grants on CDR in the data set started within the last 10 years (2013-22).”
The annual value of grants has grown from about $5m in 2000 to about $190m in 2022, the report adds.
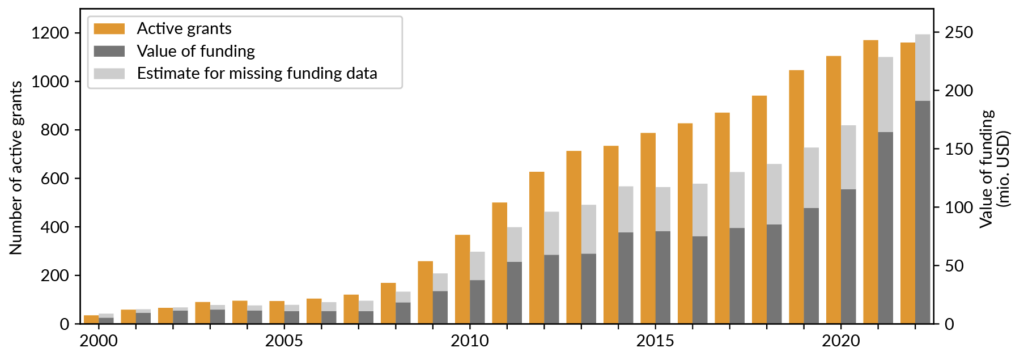
Almost 70% of all active CDR research grants over 2000-22 focus on soil carbon sequestration (35%) or biochar (33%), the report says. Although, as the chart below shows, grants “have been diversifying over time”, with an increasing share for other methods by 2022, such as DACCS (11%), peatland restoration (8%), coastal wetland restoration (7%), enhanced rock weathering (5%) and BECCS (5%).
The majority of research investment is in Canada and the US, the report says. The two countries account for 40% of all active research grants between 2000 and 2022 and 59% of the funding.
The 27 countries of the EU collectively account for around 19% of CDR funding, the report says, while just three non-EU countries – Norway, Switzerland and the UK – together account for 11%. Meanwhile, it adds, China “funds many CDR projects, but the financial support reported is comparatively small”.
Back to top
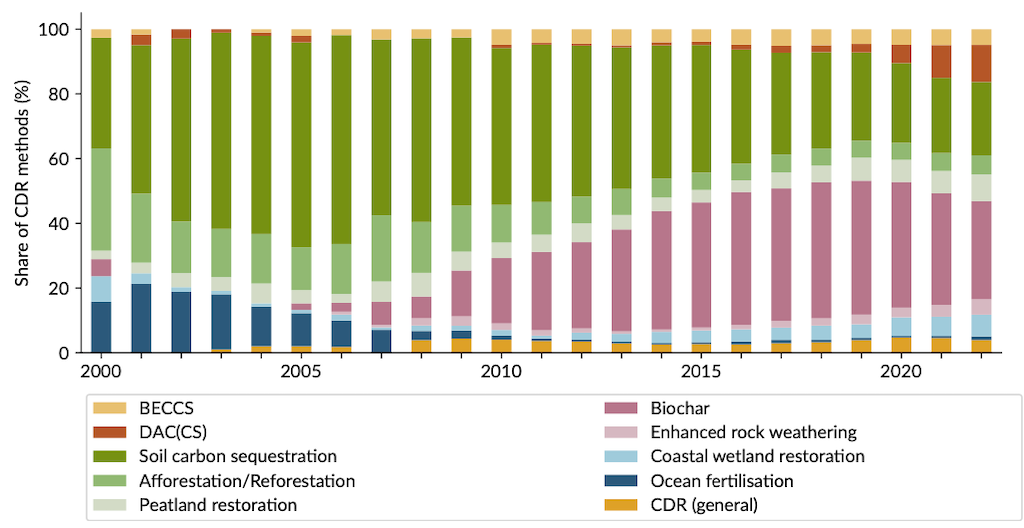
On social media, the focus on different CDR methods has changed over the past 12 years
The second edition of the report includes an update to its analysis of how CDR is discussed on Twitter. This includes extending its dataset to the end of 2022 and adding “new data on user types and posting frequency”.
In total, the dataset covers 570,000 English-language tweets over 2020-22 (and does not include retweets). The authors used machine learning to classify whether the tone of the tweets were positive, negative or neutral.
Overall, the report finds that the amount of attention that CDR received from English-speaking Twitter accounts in 2022 was similar to 2021, but “with generally more positive sentiment towards familiar and conventional CDR methods than to other methods”.
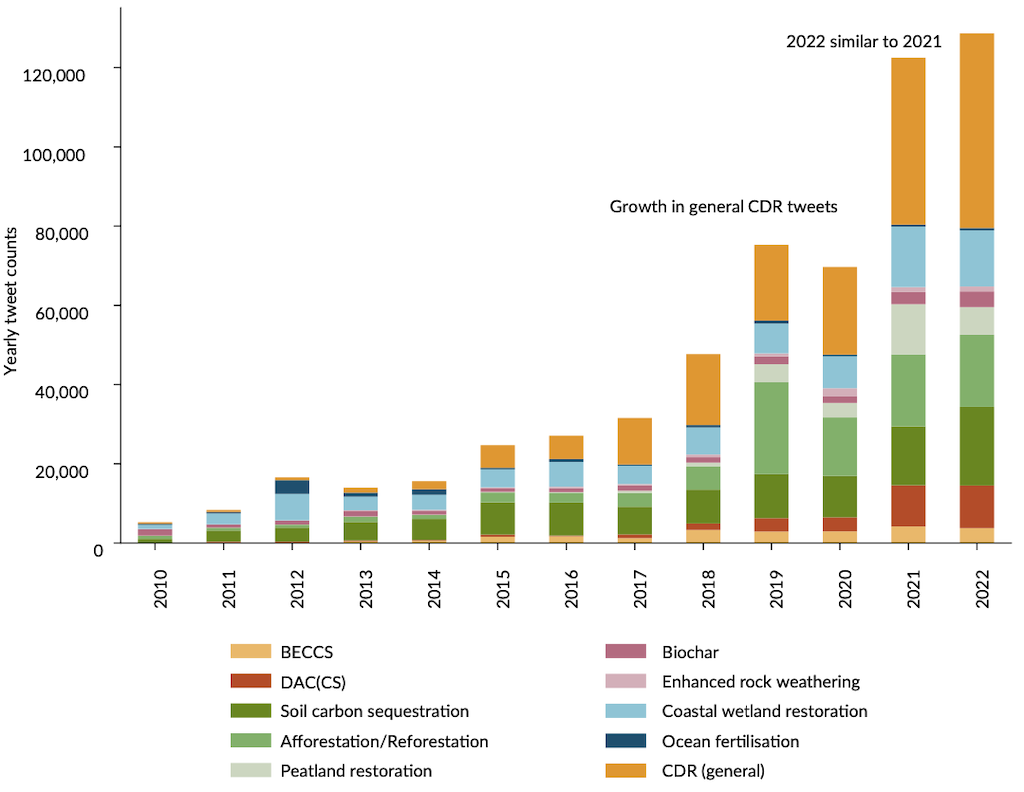
Looking across the whole time period, the authors find that “earlier tweets mainly focused on specific CDR methods, such as soil carbon sequestration, coastal wetland restoration, ocean fertilisation, afforestation and biochar”. They add that “recent years have seen an increase in the share of tweets about CDR in general, as well as an expansion to novel CDR methods such as DACCS and BECCS”.
The analysis also finds that CDR tweets have become more positive over time. For example, “tweets on biological capture methods have a positive sentiment much more often than a negative sentiment, aligning with the survey literature on perceptions”, the report says.
The majority of tweets (70%) come from users in Australia, Canada, the UK and the US, the report finds, but also from those in Belgium, Chile, France, Germany, Ghana, India, Norway and Switzerland. The report notes that “sentiments tend to be more negative in Australia, Canada and Germany than in India, the UK and the US”.
The authors also find differences in which CDR methods are being tweeted about. They write:
“For example, users from Australia, India and the US post more about soil carbon sequestration than others. UK users post more about peatland restoration and coastal wetland restoration, while Ghanian users focus on biochar and general CDR.”
Back to top
Media coverage of CDR tends to peak around COPs
The report includes new analysis of how CDR has been reported in English-speaking media around the world over the past three decades.
The chart below illustrates how CDR reporting has increased since 1990. The analysis of more than 9,000 articles shows that the “main period of media reporting” started in 2007.
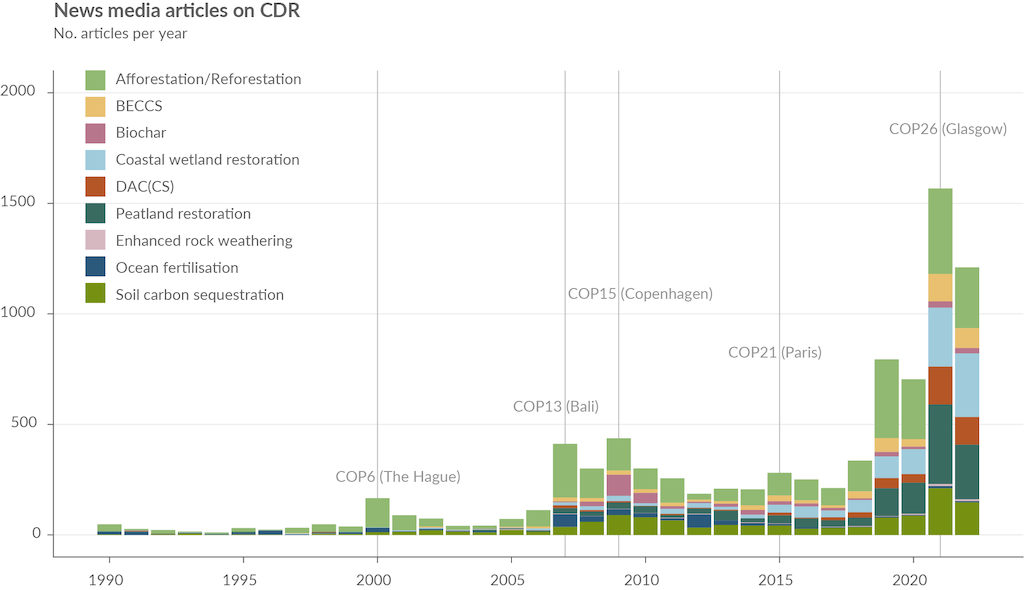
The authors identify a “major increase” in CDR news coverage from 2019, peaking in the run up to the COP26 climate summit in Glasgow in 2021 as countries updated their Paris Agreement pledges. They write:
“Since many of these targets included net-zero pledges, the resulting climate policy discourse tended to feature CDR prominently.”
For much of the three-decade period, peaks in CDR reporting have coincided with climate summits, the report adds, including “COP13 in Bali in 2007, where several international forestry initiatives were announced; and COP6 in The Hague in 2000, where the role of forests as carbon sinks first sparked significant debate under the UNFCCC process”.
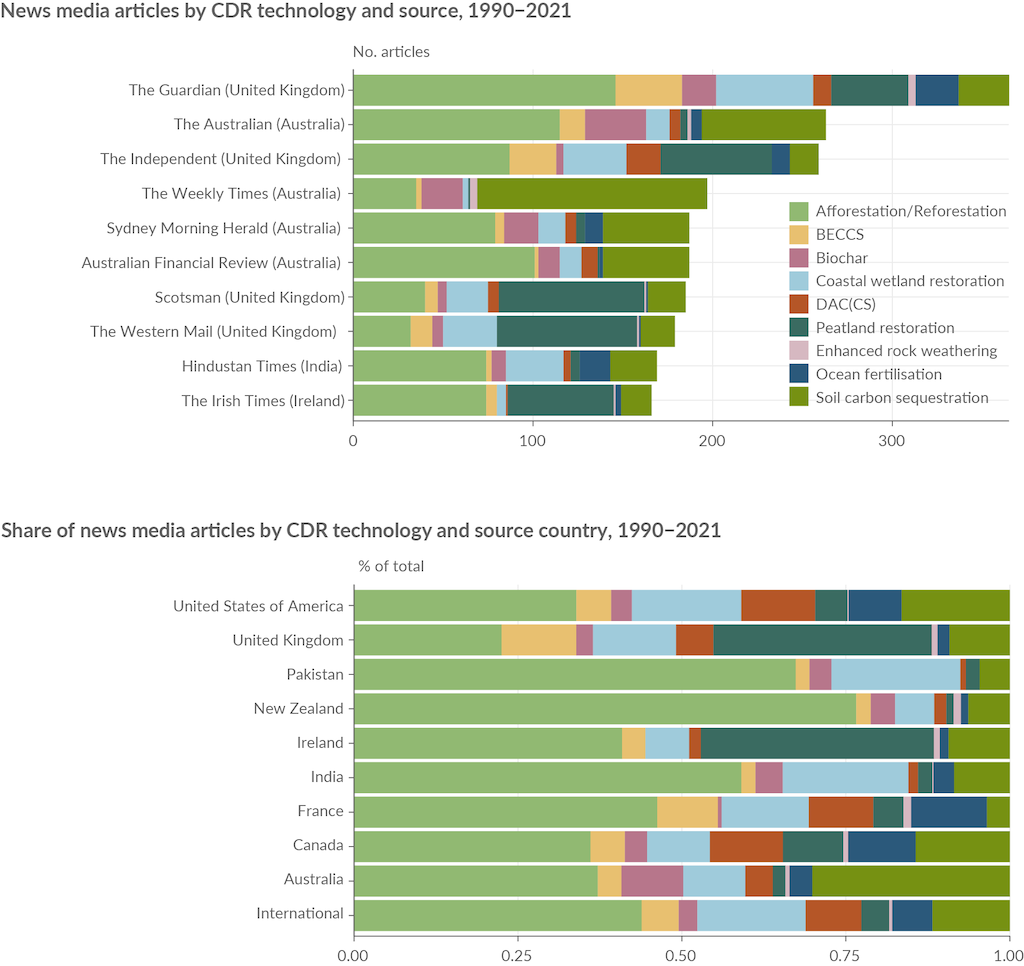
Mentions of CDR in the news are “relatively concentrated in specific news media and countries”, the report notes. As the upper chart below shows, Australian and UK press dominate coverage, accounting for eight of the top 10 sources for most articles.
The lower chart shows a breakdown of which CDR methods tend to feature in news articles for individual countries. Soil carbon sequestration features heavily in Australia, the authors note, “reflecting its higher state of integration into Australian climate policy”.
Elsewhere, peatland restoration is “more prominent in the Irish and UK press”, the report says, while afforestation and coastal wetland restoration have larger shares in India and Pakistan.
Further analysis of a random sample of 1,500 news articles suggests that CDR reporting tends to “intersect with other concepts and mitigation approaches, including (fossil-based) carbon capture and storage [CCS], carbon capture and utilisation [CCU] (e.g. synthetic fuel production, biofuels) and avoided emissions (e.g. forest carbon offsets)”.
The authors add:
“Journalists do not necessarily distinguish between these different categories of mitigation, yet it is important to communicate the specific role of CDR as distinct from emission reduction efforts.”
Back to top
Policies are needed that create demand for carbon removals
The report says that, in order to increase CDR innovation and scale-up, “policies
are needed that create demand for carbon removals”.
It says that “CDR policy gained momentum in 2023”. It observed “active efforts” in many countries for “technology push policies”, including research projects and demonstration schemes.
However, it says that “demand-pull policies”, those aimed at creating demand for CDR, “remain weak”.
NDCs contain “few mentions of policies that could create a significant demand for CDR”, it says, and “monitoring, reporting and verification (MRV), which is important for facilitating transactions in CDR markets, is not fully developed at present”.
When compared to action from policymakers, the voluntary carbon market is “playing a key role in scaling up CDR”, the report says.
The voluntary carbon market is a place where polluting businesses can buy credits from carbon-cutting projects, allowing the firms to claim they reduced their own emissions. It has been much criticised by researchers for failing to live up to promises to cut emissions.
Carbon Brief analysis shows that just 3% of carbon credits for sale on the four largest voluntary offset registries are for CDR projects, with the rest being for “avoided emissions” projects.
The first edition of the state of CDR report includes case studies for CDR policies in Brazil, EU, US and UK. The second edition includes new case studies for Canada, China, Japan and Saudi Arabia.
Back to top
Monitoring, reporting and verification is ‘essential’ for scaling up CDR, but there are dozens of different protocols
The report notes that monitoring, reporting and verification (MRV) for CDR is “critical” for ensuring that CO2 has been captured from the atmosphere and stored durably. The report defines MRV as the process of:
- Measuring or quantifying CO2 removals from a CDR activity and monitoring those CO2 removals over the course of a CDR activity.
- Reporting on those removals.
- Receiving third-party verification of the removals that have been reported.
Approaches to MRV are described in “protocols”, which the report defines as any document that outlines methods or sets quality requirements or guidelines for certification.
Robust MRV is “crucial” for “effective voluntary carbon markets, government-created markets, regulations and national reporting”, the authors say. However, at the moment, there are “many overlapping protocols, which makes comparison and oversight of CDR difficult for investors and governments alike”.
The report identifies 102 MRV protocols for CDR, which are shown in the chart below according to the year in which they were developed.
The authors note that 63% are for conventional CDR, 65% are for voluntary markets and 58% are for international activities. Some 40% have been developed since 2022.
Across the world, “Europe (including the UK) accounts for 44% of total MRV protocol development, North America makes up 42%, Oceania 5%, Asia 4%, Latin America 3% and Africa 2%”, the report says.
MRV policymaking differs across these jurisdictions, it notes:
“For example, the EU and the UK have prioritised developing CDR standards and guidelines; the US, meanwhile, has focused on scaling up market-ready CDR and developing MRV tools for specific applications, such as marine CDR. The voluntary carbon market has played a leading role, with projects developing methods for monitoring, reporting and verifying CDR projects.”
In addition, there are different MRV challenges for each CDR method, the authors say:
“For novel CDR, more research is needed to develop and test MRV technology, including at large-scale demonstration sites.”
One challenge for novel CDR methods, such as DACCS, is that they often use proprietary techniques that are not publicly available. Their MRV protocols are, therefore, “inaccessible”, the authors say, and so it is not possible to compare them with those that are public.
For conventional CDR, “questions persist” around designing flexible MRV approaches that can accommodate different contexts, scales and approaches, the report says.
While the authors describe the current lack of IPCC greenhouse gas guidance methodologies for most novel CDR methods as a “major gap”, they note that the planned IPCC methodology report on CDR, CCS and CCU “is expected to outline a framework for including novel CDR methods in national inventories”.
This framework “will likely guide best practice in the voluntary carbon market and the development of national policies”, the study says.
Sharelines from this story
